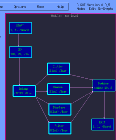

Software application data-flow-graph.


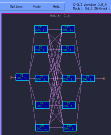
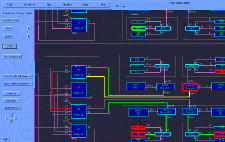
The diagram on the right is the sub-graph which under-lies the super-node clutter from the top-graph. It is at the second level of the hierarchy. It was opened by double-clicking on the super-node from the top-level graph. The DFG's are converted into pseudo-programs by the SCHEDULER tool which maps and schedules the tasks to the processor elements.
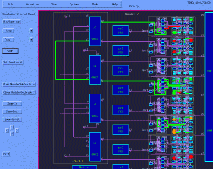
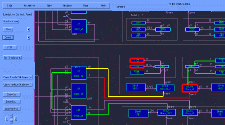
The following snapshots show the hardware architecture of the modeled system. The snapshots are from simulation animations of the 108-processor Mercury Raceway system executing the application algorithm defined above. The colors indicate computations on processor elements and data transfers on network links.

The following are the processing time-line graphs that resulted from the simulation.
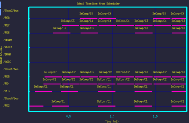

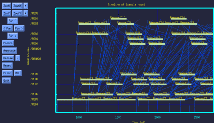
The time-line on the left is a basic time-line with annotations identifying the operations. The time-line on the right over-lays communication events between processors for greater insight into the system's operation. We call the latter graph, a spider-web plot due to its appearance.
