Time-Line PostProcessor GUI
TLPP-GUI
Introduction -
The Time-Line PostProcessor GUI (TLPP-GUI) is a tool for viewing the results of simulations. The GUI is actually a front-end for the Time-Line PostProcessor (TL-PP) tool, which converts Event-History files from simulations into Time-Line graphs.Time-Line graphs contain horizontal bars indicating the times when entities are active, such as shown in figure 1. The various entities, such as processor devices or software processes, are listed up the vertical axis. Time runs left to right on the horizontal axis.
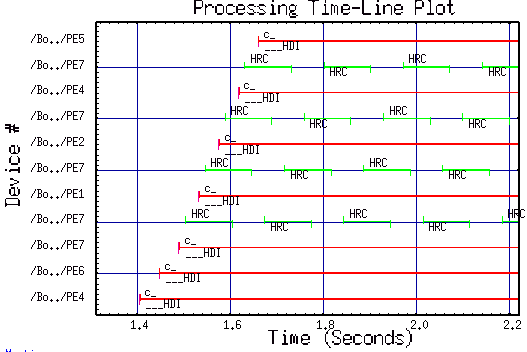
Figure 1 - Example Time-Line Graph.
The TLPP-GUI helps you set-up a command-file which drives the TL-PP,
by walking you through a set of rough eight decisions.
The TLPP-GUI is invoked from the ToolsMenu of CSIM's main GUI.
To use the TLPP-GUI, simply go through each numbered step.
At each step, there is a  button with a helpful explanation
for further assistance.
The final steps are a series of three buttons labeled A, B, C:
- A. Save the command file containing your choices,
- B. Run the TL-PostProcessor to make the Time-Line graph,
- C. View the Time-Line Graph.
Although some models produce time-line graphs directly, their format is not easily modified. The TLPP-GUI allows you to control the following aspects:
- Order of devices on the y-axis,
- Colors of specific event-types,
- Annotation styles,
- Sub-sets of devices displayed,
- Time ranges displayed,
- Styles and thickness of time-line bars,
- Graph titles.
Usage
The TLPP-GUI assists in processing the EventHist.dat results of a simulation. The TimeLine-PostProcessor (TLPP) reads event-history files produced by simulation models, such as those from CSIM's Performance-Model Library. (Note: Not all simulation models produce EventHistory output.) The TLPP-GUI first looks for the EventHist.dat file in your current directory. If it finds one, it scans the file and then prompts you with the relevant event-names, device-names, and time ranges. Figure 2 shows the TLPP-GUI.
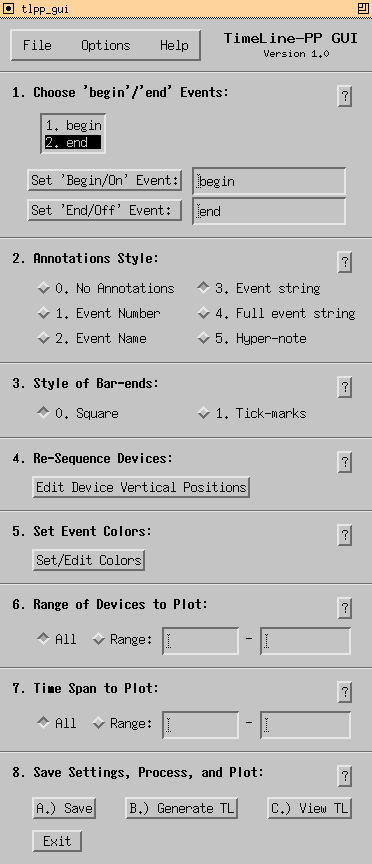
Figure 2 - The TLPP-GUI.
Step 1: Choosing begin/end Events
Event-history files contain lines of the following format:
/Device_name @ time : event_type_name optional_event_info,
For example:
/sensor2 @ 1502 : Started data write.
/sensor2 @ 2005 : Completed data write.
Typically such events record the beginnings and endings of
activities, such as processes or tasks which persist for
various durations. TLPP will convert such events into a plot
containing horizontal bars indicating the duration of the
activities. Such plots are called 'Activity Time-Line Plots'.
Or simply 'Time-Line Plots'.
Many different kinds of events may be recorded in a given event-history file. The event_type_name, is the first word after the colon (:) in the event-string. It distinguishes the different kinds of events from each other.
To produce a plot, you must identify the beginning/ending or On/Off event_type_names of for activities you wish to plot.
In the case above, the relevant names are:
Started
Completed
To assist you, TLPP scans your event-history file and lists the type-names of events that were traced. You merely need to select them from the list.
(For instantaneous events having no duration, the 'on' and 'off' event-names are the same, and will draw a single point on the graph, instead of a line-segment.)
Step 2: Choosing Annotation Styles
The Time-Line tool can place textual annotations on the time-line graph to identify the individual tasks. However, the graph often becomes too crowded with detail. Therefore, you may choose various levels of annotations. For example:
- 0. No Annotations - Turns off annotations. No text.
- 1. Event Number - Just the Event-Type's number.
- 2. Event Name - Just the Event-Type's name.
- 3. Event string - Just the text after the Event-Type.
- 4. Full event string - Everything.
- 5. Hyper-note - No text on the graph, but when you click the beginning of an activity bar, a pop-up note displays the full text of the event.
Step 3: Choosing Bar-Ending Styles:
By default, the time-line bars have square ends. This is clean and efficient for large graphs. However, when the ends of sequential tasks occur very closely, especially ones having the same color, it is difficult to distinguish the end of one from the beginning of the next. Also, tasks of very short, or zero, dimension may be difficult to resolve. Therefore, there is an option to place tick-marks on the ends of the time-line bars.
Step 4: Adjusting the Positions of Devices on Vertical Axis:
The vertical positions of the device-bars on the graph are initially set arbitrarily. You may re-adjust the positions with this option. The edit-button opens an editing window, as shown in figure 3, which lists the positions of the devices. There you can select each device and set it's position number. (Just enter the new position number.)
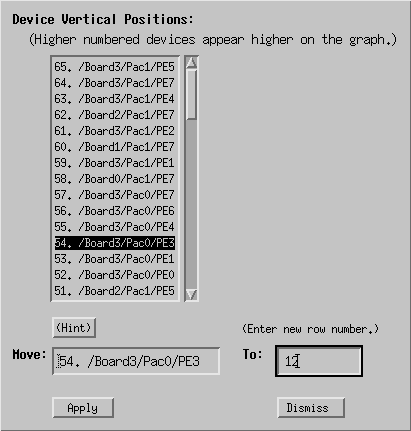
Figure 3 - Device Position Editor.
You can change the position of devices in the graph by:
- Select a device, (it's row-number will appear in the 'Move:' box),
- Type a new row-number in the 'To:' box,
- Press 'Apply' button.
Step 5: Setting Colors
You can associate distinct colors with key-words in your event-strings to produce colorful time-line plots. The colors help to visually interpret the graphic data.
Clicking the Set/Edit Colors button brings up the color-editing window, as shown in figure 4, in which you can adjust the rendered colors of events.
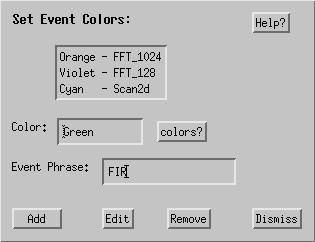
Figure 4 -
You may assign colors to specific event types. For each event-type you want colored, enter the color you want in the first box, followed by enough of a keyword from the event string to uniquely identify that type of event.
Choose colors from the color list button to the right of the color box. Names can be used for the first 16 colors, such as black, white, red, green, blue, cyan, violet, orange, yellow, pink, light-gray, dark-gray, and fuchsia. Numbers can be used for the remaining 128 colors, as defined under XGRAPH's web-page.
Example: Suppose your timeline data file contains entries such as:
/brd3/dev8 @ 345.2: start modem9_3a
/brd3/dev8 @ 345.2: done modem9_3a
Then a valid keyword for any 'modem' event could be:
modem
Special thought should be given to your event-type naming
convention so as to distinguish appropriate events.
Step 6: Device Ranges
You may restrict the plotting of events to specific ranges of devices. Specify devices by the numbers shown in section 4.
To see multiple non-contiguous device groups, run Time-Line
separately for each group, saving the plot-file to different
names for each group. Then combine on a common plot.
Example:
xgraph timeline1.dat timeline2.dat timeline3.dat
Step 7: Time-Span
You may restrict the plotting of events to specific ranges of time. This accelerates graphing of otherwise long event logs. Select All or enter a sub-range. If you select Range, the text boxes will show the range of time values contained in your simulation.
Step 8: Save Settings, Process, Plot
After selecting your desired options in the steps above, it is time to:
- A. Save your settings to a file. By convention, the file is normally called 'tl.com'. You can retrieve and edit your selections at a later time by opening the TLPP-GUI on this file, or by editing it directly. The primary purpose of the tl.com file is to drive the Time-Line Post-Processor (TLPP) tool. Therefore, the next step is (B).
- B. Invoke the TLPP to process your EventHistory file, which generates the time-line plot. Do this by pressing the second button, 'B. Generate Graph'.
- (C. Once the plot is generated, you may view the plot by pressing the third button, 'C. Plot timeline'.
Caution: Watch for errors in processing your time-line file. Generating good time-line graphs is often an iterative process. First resolve any errors. Then iterate until the plot shows the data in the clearest way.
Additional Options -
Under the Options pull-down of the top-menu bar are options for changing the thickness of the time-line bars and graph-titles, as shown in figure 5.
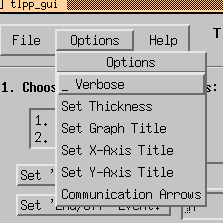
Figure 5 - Options menu.
Setting Bar Thickness:
This option enables changing the thickness of the activity bars in
the timeline graph. Line thickness is specified in points
(72-points to an inch, a standard of the printing world). The
nominal thickness value is 3.0-pts. If not specified by this
option, TimeLine attempts to adjust the thickness slightly when
the number of devices plotted is very few or very many, by making
the thickness slightly more or less, as follows:
- If ~2 devices, thickness=6.
- If ~25 devices, thickness=3.
- If ~200 devices, thickness=1.
Setting Graph Titles:
These options let you change the graph titles on the Time-Line
graph. You can set the main graph title which appears over the graph,
the x-axis title on the horizontal axis under the graph, or the
y-axis title on the vertical axis along the graph.
Communication Arrows:
This option enables display of communication events on the time-line
graph. These are shown as diagonal lines running between devices,
from the source device at the start of the transfer, to the
destination device at the completion of the transfer. These
become super-imposed on the process-timeline, and give additional
insight as to the data movements, bottlenecks, and dependencies
governing your system's execution. The arrows are sometimes
called 'spider-webs', or 'spider-plots', due to their appearance.
For further information on communication arrows, see
time-line file options.
Command Line Arguments
- No command line arguments are necessary. Without command-line arguments, TLPP-GUI defaults to looking for events in file EventHist.dat, and does not attempt to read a previously generated tl.com time-line command/options file.To specify the event file, such as EventHist.dat, place it as the first command-line argument. To specify a previously generated time-line command/options file, place it as the second file on the command-line.
See also: Time-Line PostProcessor (TL-PP) tool.