XYZ-2-WF
3-D Mesh and Surface Plotting
Contents:
1. Overview
XYZ-2-WF is a general purpose utility for converting raw three-dimensional numeric data files, such as real-matrices, into WFL-format for display within WinFrame3D (WF3D). The resulting 3D-plots can be interactively rotated and viewed from arbitrary perspectives in real-time. Images can be snapped for printing, or for including in reports, by pressing the "p" (for "picture") at any time within WF3D.
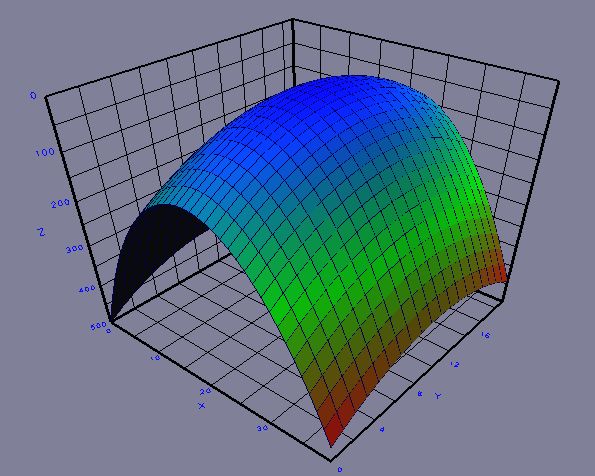
Figure 1 - Example XYZ-2-WF plot.
XYZ-2-WF supports a variety of options described further below.
XYZ-2-WF Options:
        -wireframe   - Mesh Wire-frame only.
        -surfaceplot - No mesh, smooth surface.
        -revx        - Reverse the X-axis (left-right).
        -revy        - Reverse the Y-axis (depth).
        -revz        - Reverse the Z-axis (up-down).
        -norainbow   - No color-coded height map.  Use uniform surface color.
        -title "xx"  - Set graph title label.
        -xlabel "xx" - Set X-axis label.  (Matrix columns, graph left-right)
        -ylabel "xx" - Set Y-axis label.  (Matrix rows, graph depth-axis)
        -zlabel "xx" - Set Z-axis label.  (Matrix values, graph up-down)
        -zrange z Z  - Force min and max Z-range.
        -xrange x X  - Merely sets number range displayed on the X-axis.
        -yrange y Y  - Merely sets number range displayed on the Y-axis.
        -bar_graph x - Bar-graph. (1 = rectangular bars, 2 = circular pillars.)
	-bg r g b    - Set background color. RGB values in range 0.0 - 1.0.
	-ni	     - Not Interactive.  Do not automatically invoke viewer.
        -h           - List this options summary.
2. Data Formats
XYZ-2-WF expects data in a regular X-Y grid format. Therefore, only Z-values are necessary in the data file (input). One value on a line. Rows of the X-Y grid (or matrix values) should be separated by a line containing the keyword, 'next'. (All rows should have the same number of values.) This way, you do not need to specify the row or column dimensions of your data. XYZ-2-WF determines this for you automatically.Blank lines are allowed anywhere in the file. Comment lines can be embedded in data files, by placing an exclamation mark ('!') in the first column of a line.
Example:
		! The is an example data file.
		0.6
		2.4
		1.3
		0.1
		next
		0.0
		0.9
		5.0
		0.7
		next
		0.1
		2.5
		2.2
		2.2
		next
		0.4
		2.9
		2.1
		2.0

The data are interpretted as follows:
		Z[ 0, 0 ] = 0.6
		Z[ 1, 0 ] = 2.4
		Z[ 2, 0 ] = 1.3
		Z[ 3, 0 ] = 0.1
		next
		Z[ 0, 1 ] = 0.0
		Z[ 1, 1 ] = 0.9
		Z[ 2, 1 ] = 5.0
		...
Where, Z[X,Y] represents the Z-value at row-X and column-Y in the grid (or matrix). On the initial display, the X-axis is drawn as the horizontal (left-to-right) axis. The Y-axis is drawn as the depth-axis into the screen. And the Z-axis is the vertical (top-bottom) axis on the screen.
By default, the X-and-Y axes take integer values corresponding to their row-column indices, from 0 to the number of points on the respective axis minus one. These can be renumbered by the -xrange and -yrange options.
2.1 Alternative Input Format(s) -
XYZ-2-WF also accepts the Num-Utils Real-Matrix format.Below is an example of a Num-Utils Real-Matrix formatted data:
!Note that 'next' breaks are not needed with the Num-Utils Real-Matrix format, because the row/column indices are explicit. (One data point (x,y,z-tuplet) may be placed on each line of the data file.)Real Matrix[2,2] ! r c value 1 1 52.1 ! M[1,1] 1 2 84.5 ! M[1,2] 2 1 29.4 ! M[2,1] 2 2 91.8 ! M[2,2]
3. Usage:
By default, XYZ2WF will attempt to automatically invoke the WF3D viewer, which enables one-step operation. For this to work, you must have the WF3D_CMD environment variable defined. (Automatic for CSIM users.) Otherwise, it will tell you that it created the output file with the .wfl suffix.Example:
xyz2wf matrix.dat
If you do not have the environment variable set, then you can invoke WF3D manually or by script after running XYZ2WF. If you wish to run XYZ2WF in batch-mode (non-interactively), invoke XYZ2WF with the -ni option to prevent it from invoking WF3D. Usage will then be in the following two steps:
- Run XYZ2WF on your data file. It will produce the .wfl viewable.
- Run WF3d on the .wfl file to view it.
xyz2wf -ni matrix.dat
wf3d matrix.wfl
In any case, once the 3D-Viewer pops-up, you can control the view by dragging your mouse or pressing the keyboard arrow keys. You can place the graph into an automatic slow-spin by pressing the 's' key. Pressing the 's' key again will toggle the spin off. The '+' (plus) key will increase the spin rate. The '-' (minus) key will reverse the spin. The '~' (tilda) key will decrease the spin-rate.
You can switch the modes controlling what the mouse does by pressing different number keys as listed on the screen when WF3d starts up, or when you press 'h'. A quick summary of the most useful modes is:
- 4 - Mouse drags change the viewing-angle and orientation. (left-right, up-down)
- 6 - Mouse drags change the look-diriection, or the pointing angle of the virtual camera. (left-right, up-down)
- 7 - Zoom toward or away from the graph. Recomended to follow with '0' (zero) to reposition the pointing location to origin (0,0,0) at the center of the graph.
- p - Take a picture snapshot of the current scene.
- q - Quits out of the graph.
Test Data File -
A test data file can be downloaded from: test_3d.zip
4. Options:
XYZ-2-WF contains several options for presenting graph data. To see a list of the options, invoke with -h.Below is a quick summary of the command-line options, followed by detailed descriptions.
4.1 Options Summary:
-h - List summary of the options.
-wireframe - Mesh Wire-frame only. Supresses the solid surface.
Normally, both the mesh and surface are printed.
-surfaceplot - No mesh, smooth surface. Supresses the wireframe mesh.
Normally, both the mesh and surface are printed.
-revx - Reverse the X-axis (left-right).
Normally, the X-axis ranges from 0 to Ncols, from left
to right, where Ncols is the number of columns in your data
matrix. This is intuitive as a graph, because it places the
origin at the left, as if viewing the 1st quadrant on the
cartesian plane. However, reversing the axis is intuitive if
viewing from above, to interpret as a matrix whose columnns
and rows span left-to-right and top-to-bottom respectively.
-revy - Reverse the Y-axis (depth).
See -revx above, same but for Y-axis.
-revz - Reverse the Z-axis (up-down).
Turns graph upside down. This is helpful for viewing some
types of data.
-norainbow - No color-coded height map. Use uniform surface color.
By default, the plot is color-coded by value in a
temperature-raninbow pattern, where the lowest
values are blue (cold) and the higher values are red (hot).
The -norainbow option makes the surface a uniform gray.
-title "xx" - Set graph title label. This will appear atop the graph.
If the title is to contain multiple words, enclose in quotes.
-xlabel "xx" - Set X-axis label. (Matrix columns, graph left-right)
The X-axis label will appear under the X axis. Defaults to "X"
if not supplied. If the axis label is to contain multiple words,
then enclose them in quotes.
-ylabel "xx" - Set Y-axis label. (Matrix rows, graph depth-axis)
The Y-axis label will appear next to the Y axis. Defaults to "Y"
if not supplied. If the axis label is to contain multiple words,
then enclose them in quotes.
-zlabel "xx" - Set Z-axis label. (Matrix values, graph up-down)
The Z-axis label will appear next to the Z axis. Defaults to "Z"
if not supplied. If the axis label is to contain multiple words,
then enclose them in quotes.
-zrange z Z - Force min and max Z-range. This sets the floor and ceiling level
of the graph. It can be used to truncate the plotted surface, or
to extend the range. Useful when plotting many cases to enforce
consistemt range on all graphs.
-xrange x X - Merely sets number range displayed on the X-axis. By default the
axis numbers range from zero to the number of data-columns.
In some applications, the columns actually correspond to meaningful
physical quantities or conditions, such as pressure, temperature,
velocity, or etc.. This options enables you to re-scale the
axis numbering into the native units. For example 520 to 780,
or 0.01 to 0.08, etc..
-yrange y Y - Merely sets number range displayed on the Y-axis.
See -xrange above, same but for Y-axis.
-bar_graph x - Bar-graph. (1 = rectangular bars, 2 = circular pillars.)
Switches the plot from surface/mesh to bar-graph style.
Gives choice of rectabgular bars (1), or circular pillars (2).
Figure 2 below is an example of the Num-Util data from Section 2.1
above, plotted as rectangular bars (1). The plot command was:
xyz2wf -bar 1 data.dat
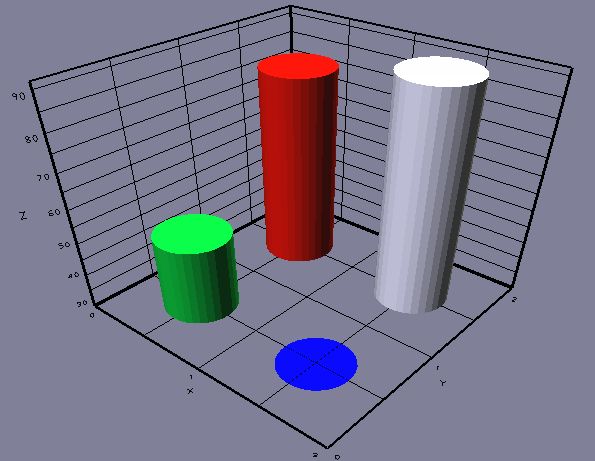
Figure 3 below is the same data plotted as cylindrical pillars (2).
The plot command was:
xyz2wf -bar 2 data.dat
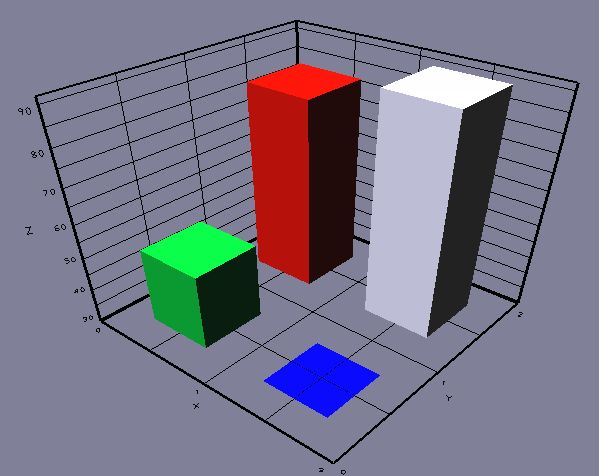
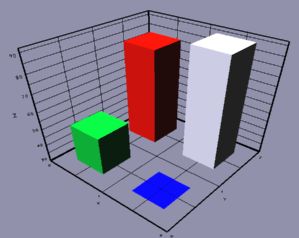 Figure 2 - Example of Bar-graph with rectangular bars.
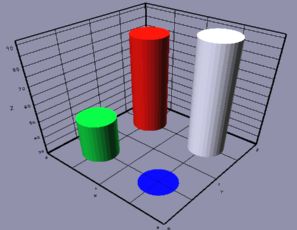 Figure 3 - Example of Bar-graph with cylindrical pillars.
-bg r g b - Sets background color to Red-Green-Blue values in range 0.0 - 1.0.
Example: -bg 1 1 1 (Sets background to bright-white.)
Default background is {0.5, 0.5, 0.5}, which is gray.
Figure 3 - Example of Bar-graph with cylindrical pillars.
-bg r g b - Sets background color to Red-Green-Blue values in range 0.0 - 1.0.
Example: -bg 1 1 1 (Sets background to bright-white.)
Default background is {0.5, 0.5, 0.5}, which is gray.
5. Download:
Download w2wf:- xyz2wf.tar.gz - Precompiled executable for Linux PCs.
- xyz2wf.zip - Precompiled executable for Ms-Windows PCs.