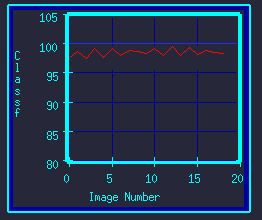
Example of XY-Graph (Scope) Gadget
 This plot-gadget automatically enforces the drawing area, so your data
 may exceed the display range without worry of drawing outside the plotting
 area.

 The formal definitions are:

   plot_init( char *obj_name, char *xtitle, char *ytitle )

	The obj_name is the name of the box where the graph should be
	displayed.  This is normally, MY_NAME.  The xtitle and ytitle
	are the axes labels that should displayed on the graph for the
	two axes respectively.  For example, "Time", vs "Temperature".
	The plot_init routine is usually called once at startup.

	It could be called again if the user resizes the simulation window,
	by detecting a changed value to the global integer, redraw.

	The graph is automatically scaled to fit over the box that is
	pointed to by the obj_name/MY_NAME parameter.


   plot_axis_y( char *obj_name, float ymin, float ymax, int nogrid,
		int scolor, int gcolor )

	The obj_name is the name of the box where the graph should be
        displayed.  This is normally, MY_NAME.  The ymin and ymax parameters
	are the ranges of the y-axis.  The nogrid flag controls whether
	grid lines are drawn.  0 turns grids off, while 1 activates it.
	The color of the axis numbers is set by scolor.  The color of the
	grid lines is set by gcolor.

	This routine can be called if the y-axis range changes
	during the simulation.  It should be called first with the
	old ranges and black colors to erase the old numbers, before
	calling it with the new ranges.


   plot_axis_x( char *obj_name, float xmin, float xmax, int nogrid,
                int scolor, int gcolor )

	Like plot_axis_y, but for X-axis (horizontal axis) numbering
	and grid lines.

	Often, one axis stays fixed, such as the Y-axis, while the
	other moves, such as the X-axis.  The axes can be updated
	individually, as needed, by these routines.


   plot_update( char *obj_name, float xmin, float xmax, float ymin,
		float ymax, struct plot_record *plot_data, int color )

	The obj_name is the name of the box where the graph should be
        displayed.  This is normally, MY_NAME.  The ymin, ymax, xmin,
	and xmax parameters are the ranges of the y- and x-axes
	respectively.  The plot_data is a pointer to a linked-list
	containing the data points to be plotted.  It should have the
	following structure:

		struct plot_record
		 {
		  float x, y;
		  struct plot_record *nxt;
		 };

	The color parameter controls the color of the line drawn.

	Multiple plot lines can be draw with this routine by calling
	with each data-set separately.  They can each be drawn with
	different colors.

	If the axis is moved (range is changed), plot_update should be
	called with the old data and range but with black color to
	erase the old curve.  Then re-called with the new data, ranges,
	and non-black color to draw the new curve.

  Example:

	   /* Display initial graph panel with borders and titles. */
	   plot_init( MY_NAME, "X-Axis", "Y-Values" );
	   plot_axis_x( MY_NAME, 0.0, 105.0, 0, Gold, Blue );
	   plot_axis_y( MY_NAME, 50.0, 250.0, 0, Gold, Blue );

	   /* Convert array of data, of length N, into plot_record. */
	   grph = 0;  /* Initialize head of list to zero. */
	   for (i=0; i!=N; i++)
	    {
	     tmpgrph = (struct plot_record *)malloc(sizeof(struct plot_record));
	     tmpgrph->nxt = grph;   /* Push new element onto list by attaching */
	     grph = tmpgrph;        /* list to element, and replacing list's head. */
	     grph->x = (float)i;    /* Set new element's data values. */
	     grph->y = vector[i];
	    }

	   /* Display the data. */
	   plot_update( MY_NAME, 0.0, N, 50.0, 250.0, grph, Green );

	   /* Free the old data. */
	   while (grph!=0) { tmpgrph = grph->nxt; free(grph); grph = tmpgrph; }


  Convenient general-purpose oscilloscope-style box-models are part
  of the Vector-library.  Device-type, XYgraph, accepts vector-data on
  its input port and displays the data updated on graphs.  The XYgraph2
  model is like XYgraph, but accepts and displays two vectors.
  These models use the above routines, and serve as more complete
  examples of how to use them.  They are also useful self-contained
  display-boxes for use with the vector elements without need for
  manipulating the basic xy-plot gadget routines.